1
Power BI dashboards
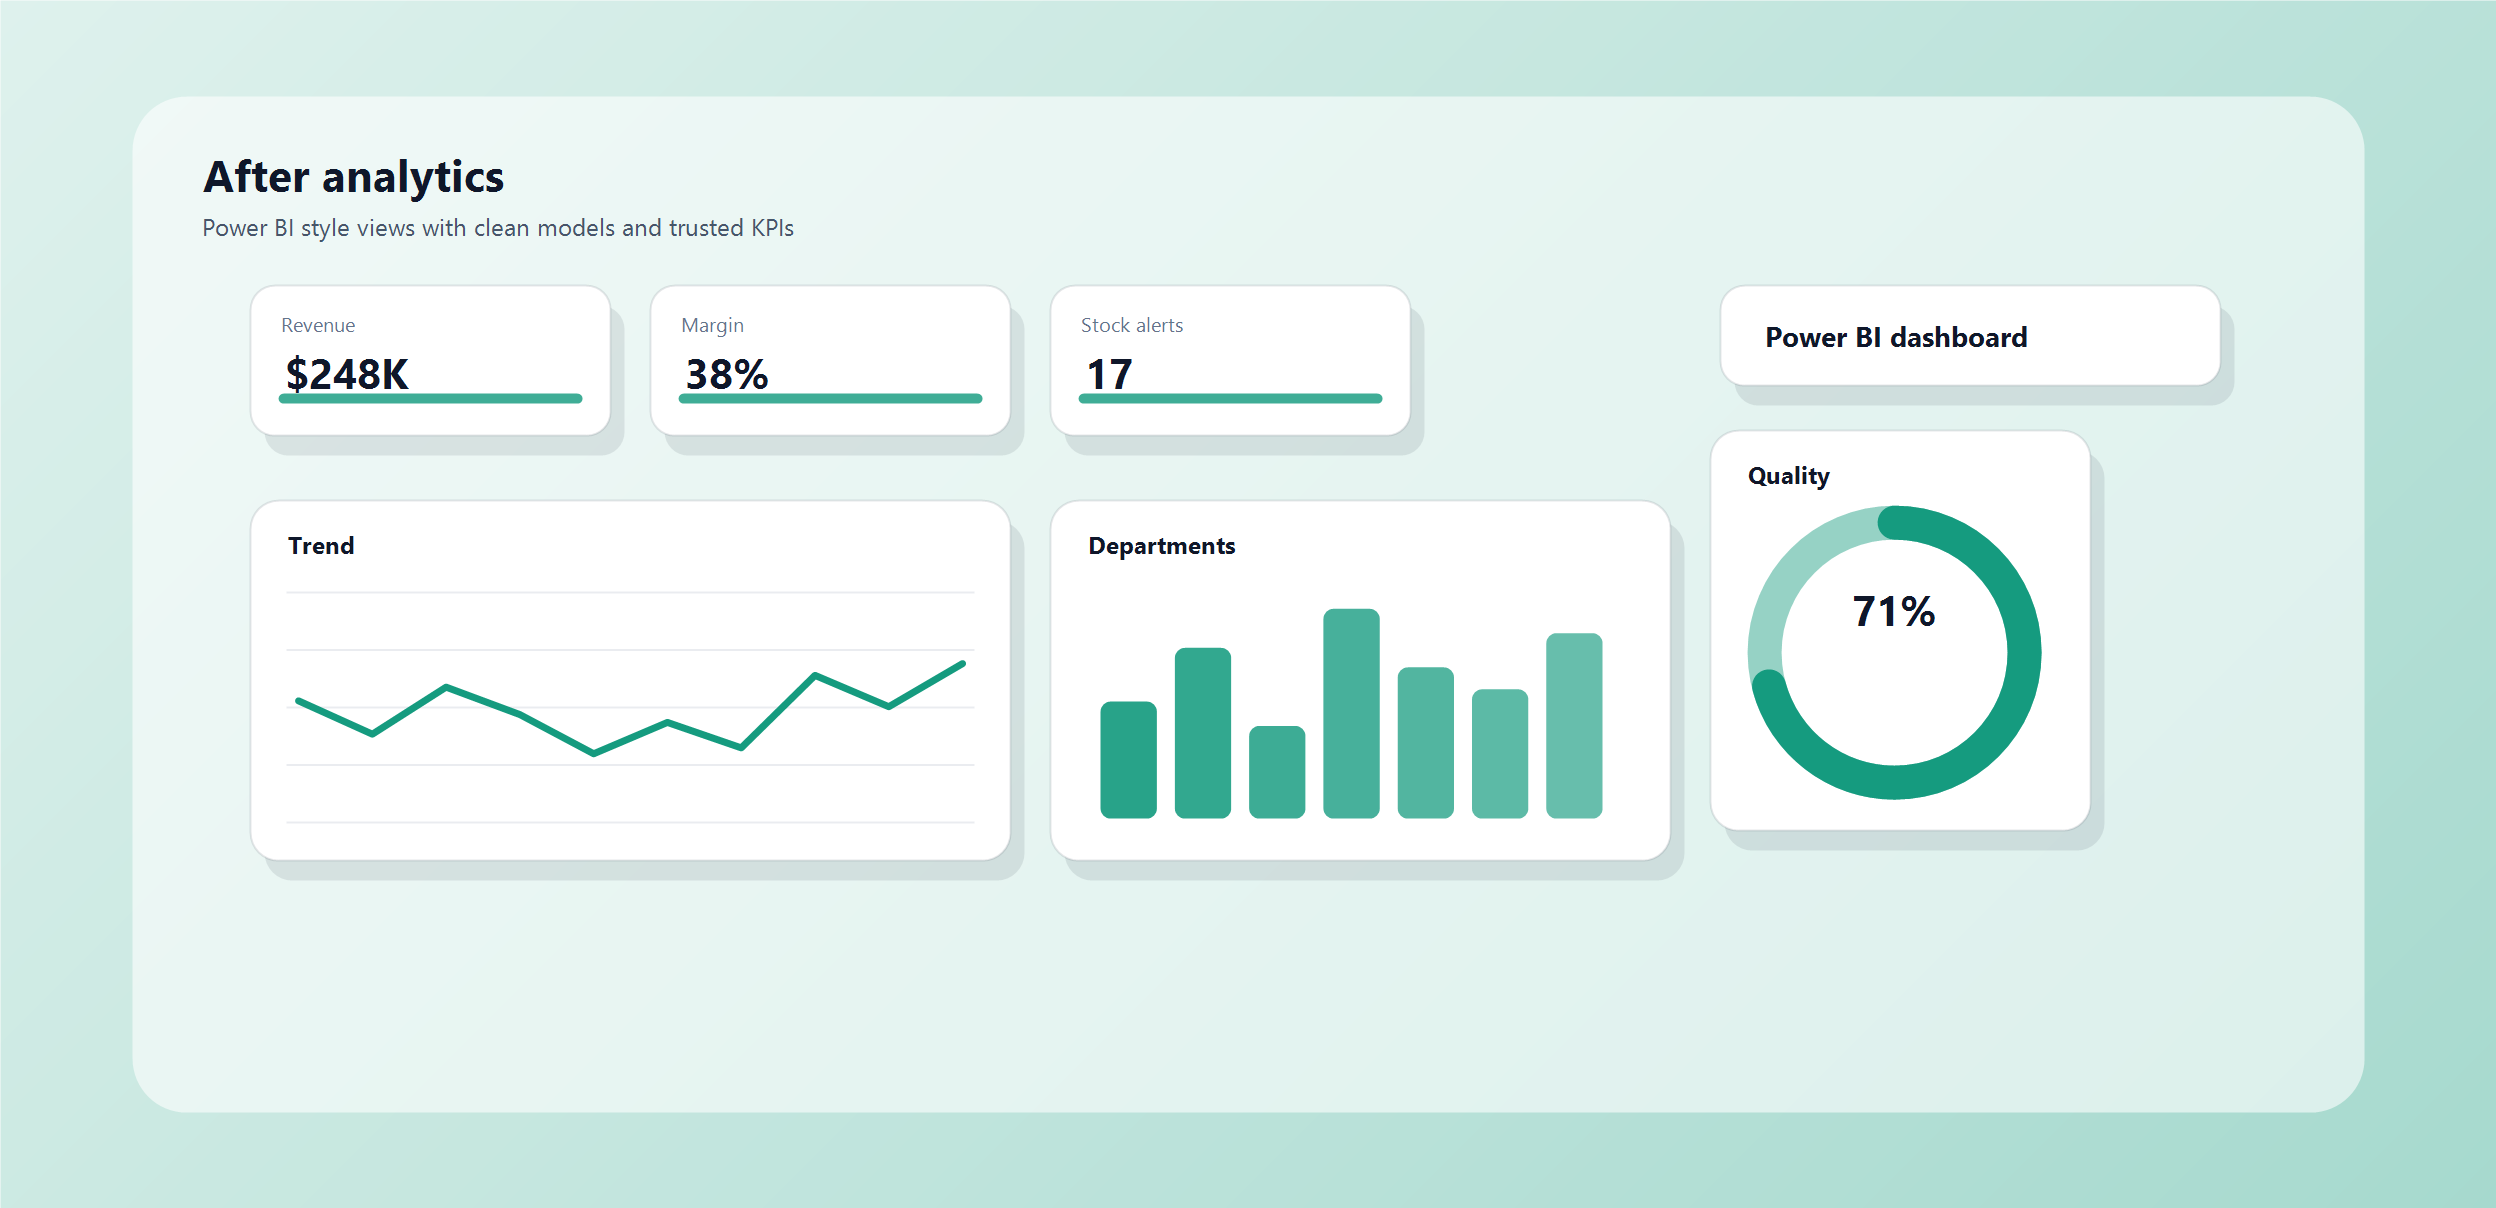
Leadership, sales, HR, payroll, stock and operations views.
Why analytics and AI?
Decisions get faster when data is clean, KPIs are visible and workflows are connected. We build the reliable foundation before adding Power BI, automation or AI.


Executive, sales, HR, payroll, stock, and operations KPIs in reports that are easier to refresh, share, and trust.

Data models, databases, pipelines and reporting flows that keep numbers consistent across departments.
Clean data can become KPI reports, data pipelines, Power BI dashboards, and AI-assisted summaries that managers can trust.
We clarify indicators, data sources, calculations and verification rules.
We create useful views for leadership, finance, HR, operations and field teams.
We add summaries, document search, report checks and workflow help when the data foundation is ready.
Leadership, sales, HR, payroll, stock and operations views.
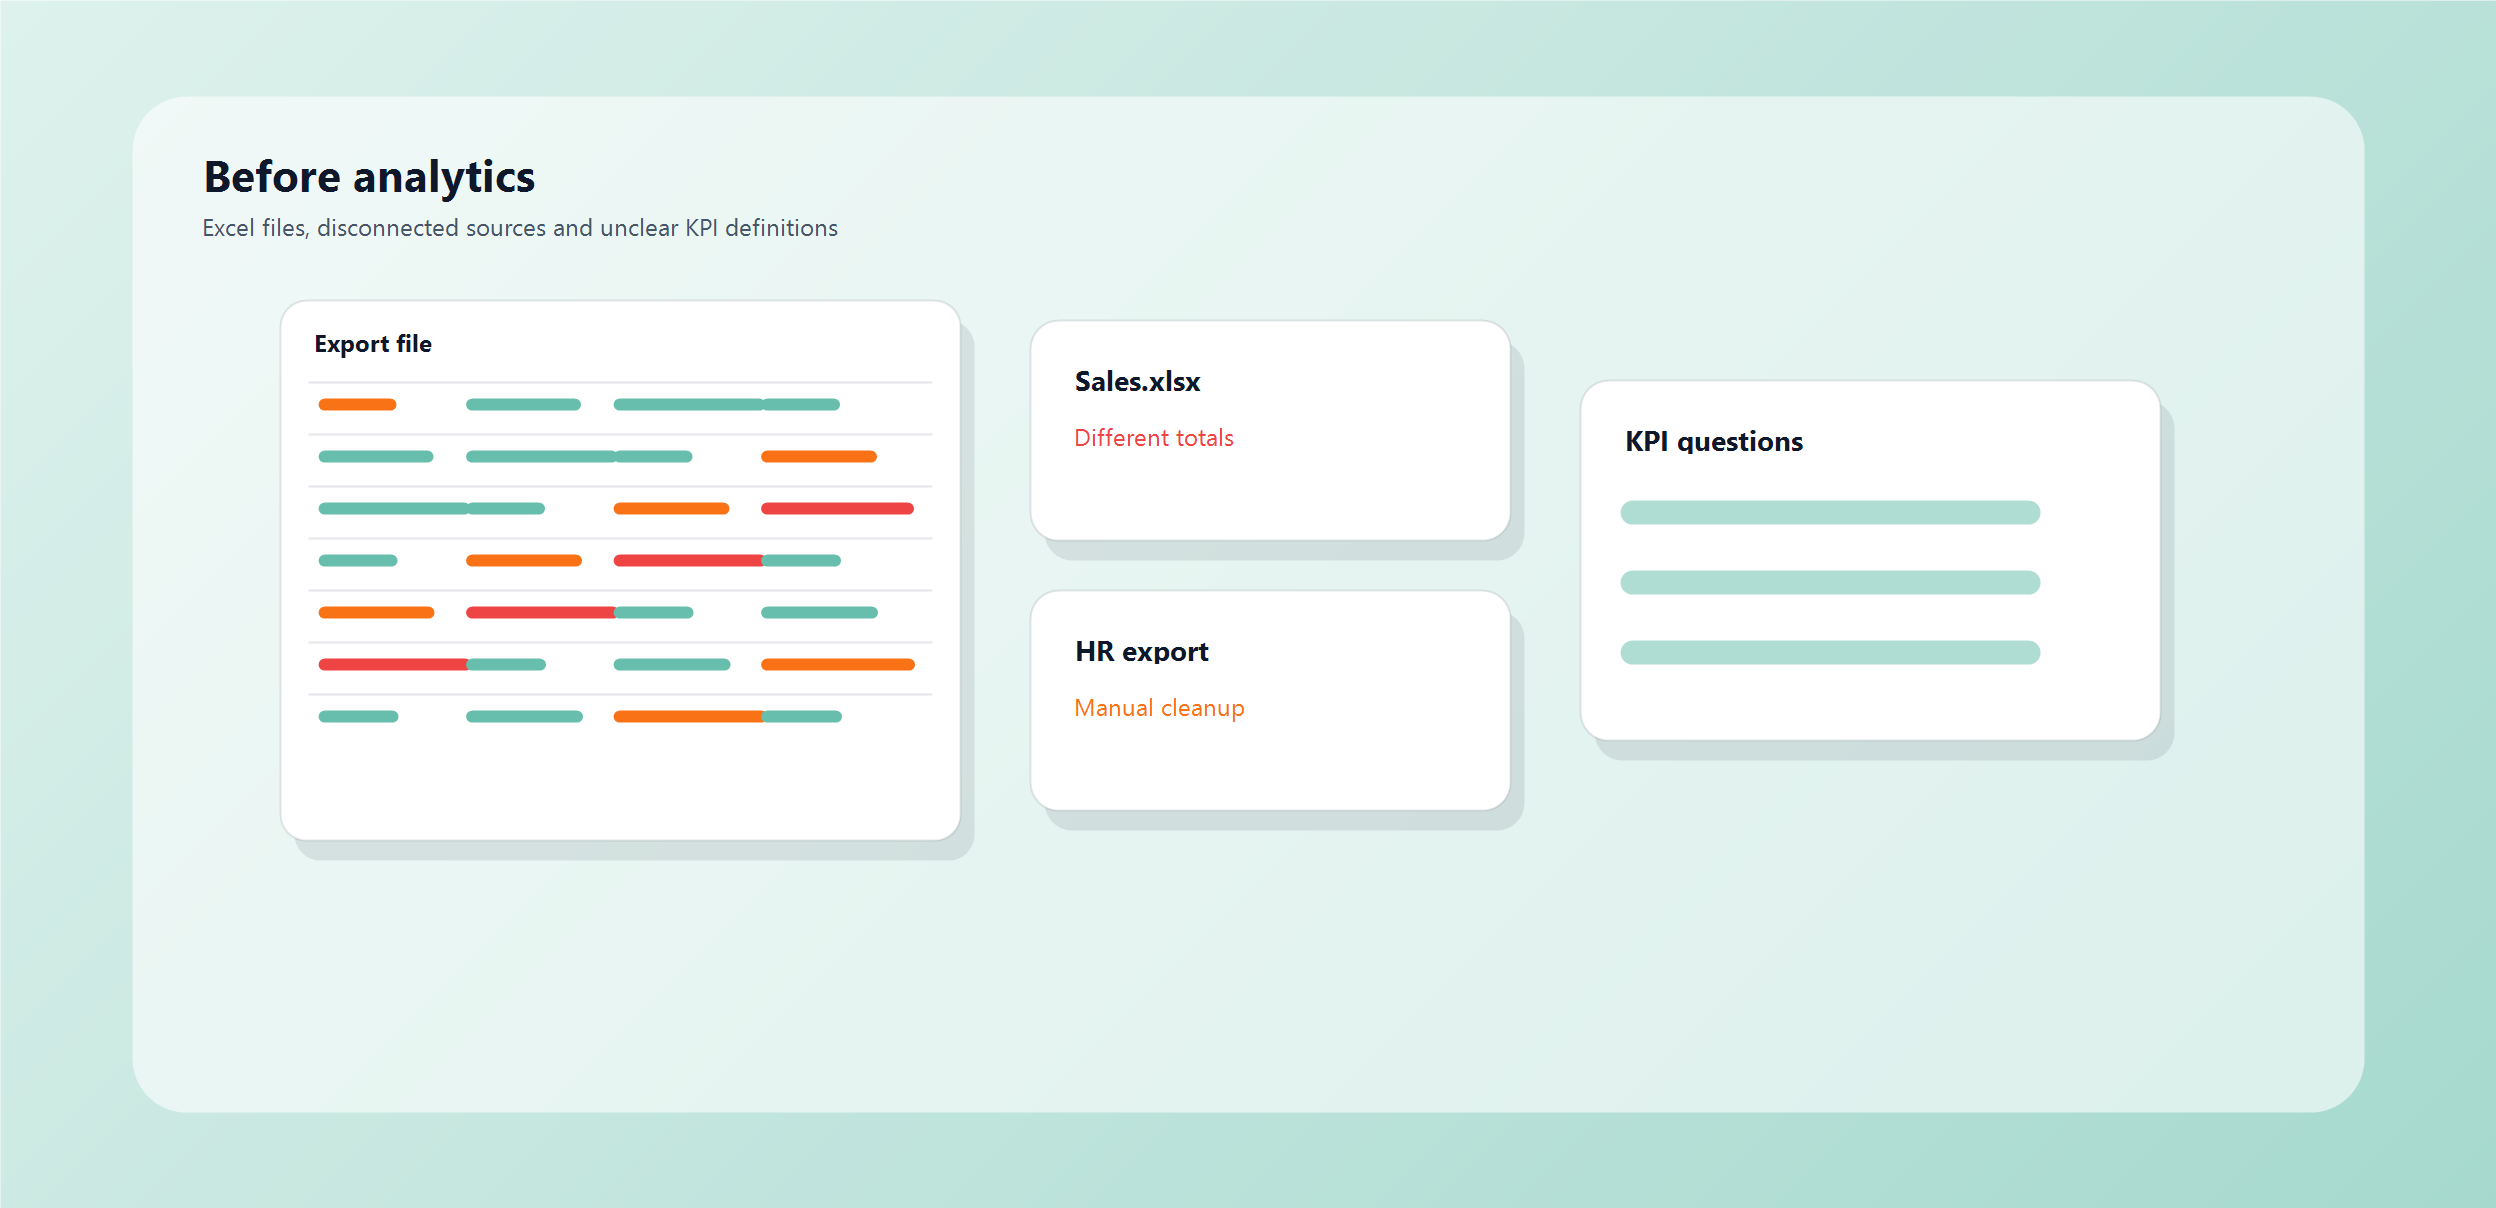
Move from manual files to reliable, refreshable reports.
Clean flows between sources, databases, tools and dashboards.
Clear definitions so teams stop arguing about different numbers.
Summaries, search, alerts and report checks.
Improvements, maintenance and new needs after launch.
"Dashboards become useful when the data, definitions and daily workflow are reliable."
We start with the business questions, then connect, clean, model and visualize the data.
Define decisions, KPIs and users.
Connect files, databases, exports and existing tools.
Clean, structure and verify calculations.
Deliver useful reports, Power BI views and AI workflows.
Define decisions, KPIs and users.
Connect files, databases, exports and existing tools.
Clean, structure and verify calculations.
Deliver useful reports, Power BI views and AI workflows.
4 principles for useful analytics
Dashboards should not only look good. They should be reliable, readable and connected to decisions.
Tell us about your current files, KPIs and reports.
Every view should be quick to understand for the teams using it.
Calculations, sources and definitions should be clear and checkable.
Dashboards should stand on clean data flows, not copy-paste work.
A useful report helps the team decide what to do next.

Tech Solutions RDC
Analytics and AI team
Tech Solutions RDC can review your workflow and propose a practical system for your business.